
Introduction
The National Institute of Medicine defines “Consumer Health Informatics” as a field in information science concerned with the analysis and dissemination through the application of computers of information designed with multiple consumers or individual patients as the intended audience (Consumer Health Informatics, 2018). “Consumer Health Information”, a by-product of consumer health informatics, is the information intended for potential users of medical and healthcare services, with an emphasis on self-care and preventive approaches as well as information for community-wide dissemination and use (Consumer Health Information, 2005) .
As Demeris (Demiris, 2016) states, as early as the 1990s scientific literature in the field of consumer health informatics primarily focused on the quality of information that consumers were able to access from libraries, mass media, and the early versions of web-based health information, which would prepare them for a clinical encounter or help them better understand a disease or treatment plan.
This paper is a bibliographic analysis of a representative sample of the currently available literature on Consumer Health Information (CHI) and Libraries. The paper identifies the prevalent themes in the study and research of the role of libraries in the development and delivery of Consumer Health Information.
The results of this analysis will contribute to the development of a controlled vocabulary of terms which will facilitate future information searches and enable me to better assist others conducting research in this area.
Research Question
The goal of this analysis is to answer the following questions:
- What are the most prevalent themes in the literature on this topic?
- What are keywords that can be used for information searches on this topic?
- Who are the most frequently cited authors on this topic and what are their areas of focus?
- Are there any emerging trends in the literature on this topic?
Data Description
Data for this paper was collected from two different sources for the purposes of conducting both Topic Modeling as well as Bibliometric Analysis in R and VOSviewer.
Phase I
For the Topic Modeling Analysis, I conducted a search in EBSCOhost Academic Search Complete using the query, SU(Libraries) AND TX(“Consumer Health Information” ) Published Date: 20000101-20201231. This yielded 457 results which I exported to an XML file
I used the R xml2 package to import and read the XML file data and save a subset to a dataframe comprised of 440 objects and two variables. The first variable in the dataframe was an integer serving as a document identifier, the second was the document abstract. These results were written to comma delimited file. I then imported the comma delimited file and used the R SnowballC and tm packages to create a corpus, remove unwanted characters, perform tokenization, stopword elimination, and stemming. Next, I created a document term matrix and frequency table which contained 3,558 unique terms. The document term matrix was used to conduct topic modeling using a Latent Dirichlet Allocation (LDA) and Gibbs sampling. I will discuss this in the next section under Data Analysis and Results The term table was sorted in order of decreasing frequency and saved to a comma delimited file. The following table lists the top 50 terms in descending order of frequency.

Phases II and III
Since the search in EBSCOhost Academic Search Complete resulted in less than a sample size of 500 documents, I conducted a search in SCOPUS using the query:
“Consumer Health Information” AND libraries AND ( LIMIT-TO ( PUBYEAR , 2010 – 2020 ) ) AND ( LIMIT-TO ( LANGUAGE , “English” ) ). This yielded 1,588 documents.
I exported the bibliographic data in both bib-text for bibliometric analysis in R, and comma delimited format for analysis in VOSviewer.
Data Analysis and Results
Phase I – LDA Topic Modeling
In this phase, I used the R Topicsmodel package to perform a Latent Dirichlet Analysis on the document abstracts which I collected from EBSCOhost Academic Search Complete. As discussed during the course lecture this is a good method for extracting document topics from a large unstructured collection of documents, discovering patterns between documents, and discovering the probability of the distribution of words within topics (Joo, 2020, p. 28). Topic Modeling has many practical applications for library science including information retrieval, content-based recommendation systems, document summary, social media mining for teaching information literacy, and bibliometrics (Joo, 2020). Latent Dirichlet Analysis with Gibbs Sampling is essentially a statistical method for calculating the probability of the distribution of terms within documents and based on the frequency of those terms, creating clusters which define topics. Doll (Doll, 2019) describes this as reverse engineering a topic. Instead of beginning with a topic and discovering which terms belong to the topic, you discover the terms, the frequency of those terms in similar documents, and based upon frequency and similarity, define topics.
I initially ran a LDA analysis to identify 20 topics and 10 terms within each topic. However, the results appeared to be too fragmented. I then opted to identify 15 topics and the top 12 terms within each topic. The results are displayed in Appendix I. As you can see the R program does not assign names but only numbers to the topic. Therefore, the topics are still left to subjective interpretation. I hypothesized that the topics could be identified as: 1.) CHI resource formats; 2.) the need for access to CHI; 3.) how libraries provide training to their staffs and/or the public; 4.) CHI resources referred by clinics; 5.) online CHI resources; 6.) programs conducted by the National Libraries of Medicine; 7.) the role of medical or academic librarians; 8.) medical education and research; 9.) health information literacy; 10.) study and evaluation methods; 11.) articles published in journals; 12.) the Medical Library Association; 13.) digital library resources; 14.) community interaction; and. 15.) searching biomedical resources. Appendix II displays a sample of the topic frequency per document output. It shows that Topic I has a 2.45% frequency of appearing in document one. The table below is a sample of the document to topic analysis. This shows that the main topic for document 1 is topic 3, which I identified as “how libraries provide training to their staffs and/or the public”. Appendix II shows that topic 3 occurs with a 17.6% frequency within document 1.

However, due to the subjective nature of the topic labeling, I wanted to conduct other forms of bibliographic analysis.
Phase II – Bibliometric Analysis in R
As explained in the course lecture, bibliometrics uses quantitative methods, such as statistics and mathematical analysis to examine documents for the correlation that may be derived or inferred in relation to the production, manipulation, or redistribution of information (Joo, 2020). As van Eck and Waltman (van Eck & Waltman, 2014) explain there are three popular approaches for visualizing bibliometric data: distance-based, graph based, and timeline based.
In this phase I used the R bibliometrix package to analyze the data collected from SCOPUS. This analysis identified that the 1,588 were derived from 675 sources. There are: 4583 authors, 2.89 authors per document, 5575 keywords Plus (ID), 3024 author’s keywords (DE), and 12.06 average citations per documents. The full summary of the results can be seen in Appendix III. See the visualizations for this data in the following section on Data Visualizations.
Phase III – Bibliometric Analysis in VOSviewer
Due to the element of subjectivity in the LDA method of topic identification, I decided to conduct a keyword co-occurrence analysis in VOSviewer. For this analysis I used the same set of SCOPUS data used to conduct the bibliometric analysis in R. VOSviewer identified 7,524 keywords. I limited the visualization to keywords that appeared more than 30 times, 138 terms met that threshold. The resulted analysis identified five clusters and 8030 links, with a total link strength of 84,669.
VOSviewer takes a distance-based approach to visualizing bibliometric networks. As van Eck (van Eck & Waltman, 2014) explains a bibliometric network consists of nodes and edges, with the edges indicating the relations between pairs of nodes. Since bibliometric networks are usually weighted networks, the visualizations in the next section show edges indicating not only a relation between two nodes but also the strength of the relation.
Data Visualization
Bibliometric Network Plots in R
The following visualizations reflect the bibliometric analysis summary in Appendix III

As cited by van Eck and Waltman, the most used techniques for creating graph-based visualizations of bibliometric networks is the graph drawing algorithm of Kamada and Kawai (1989), the algorithm of Fruchterman and Reingold (1991), and the standard circle type.
A. This visualization is an author similarity plot using Salton’s similarity index and the Fruchterman algorithm

B. The following visualization reflects the author collaboration using the Kamada algorithm

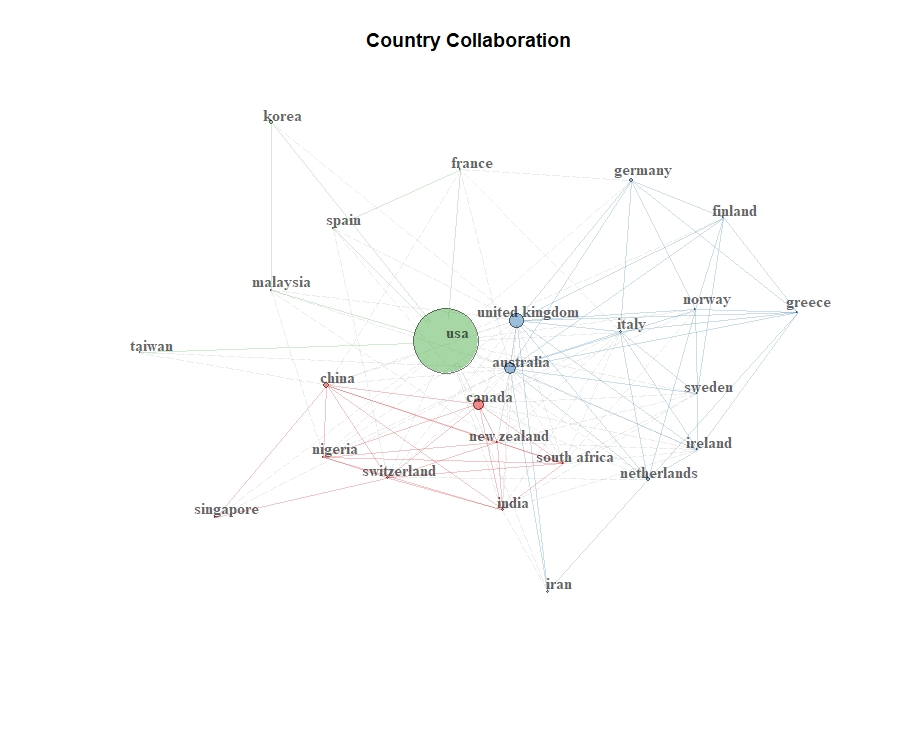
C. The following visualization reflects collaborations by country
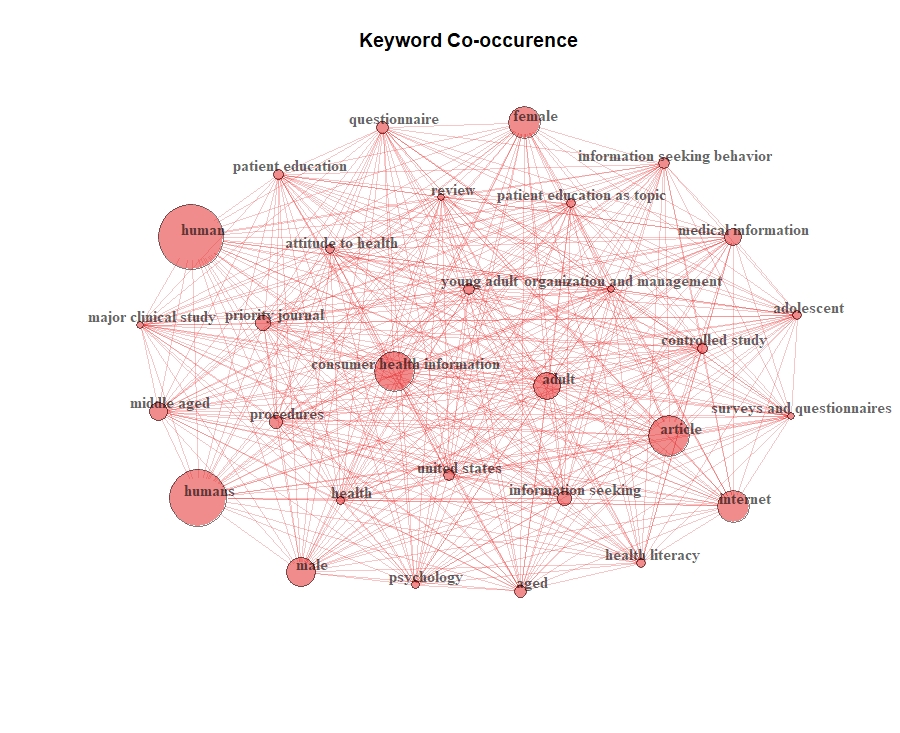
D. This visualization reflects a keyword occurrence
Bibliometric Network Plots in VOSviewer
This is an overall visualization of keyword co-occurrence using circle nodes.

This is a visualization of keyword co-occurrence using frames

Cluster 1 is represented in red and the main keyword is “customer health information” which 137 links, 7174 total strength and 659 occurrences. Other keywords in this cluster include terms like health information, medical informatics, information retrieval, search engines, websites, online system, Medline and public health.
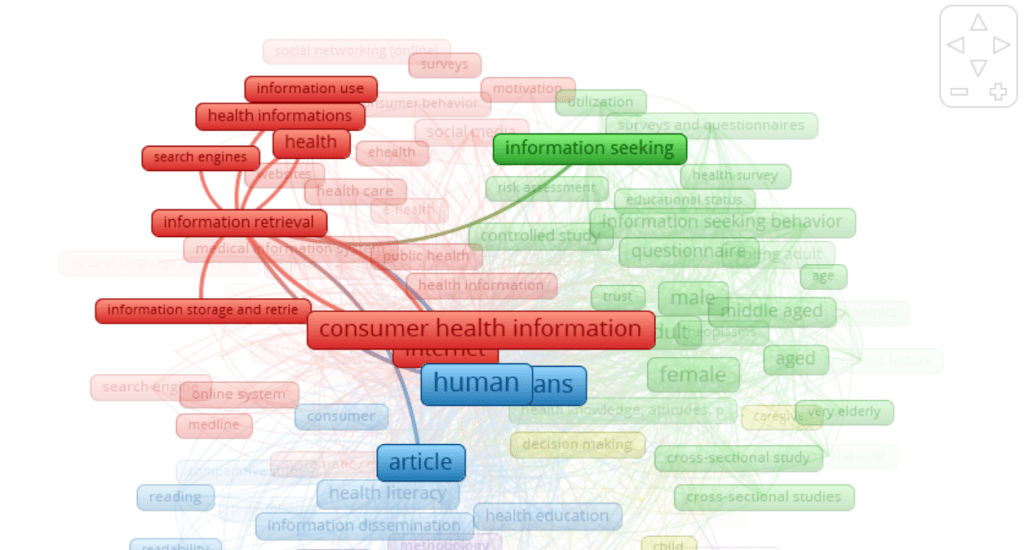
Cluster 2 is represented in green. The main theme of this cluster is patient demographics, behaviors and evaluation methods. The most prevalent keywords are demographic identifiers like adult with 338 occurrences, male with 340 occurrences, and female with 381 occurrences, all with 137 total links.
Cluster 3 is represented in blue and the main keywords are “human” and “humans” which both have 137 links. These keywords are strongly related to the terms article. health education, health literacy, information dissemination, library, organization and management, patient education, comprehension, and readability.

Cluster 4 is represented in yellow. The term most widely linked term is information processing. This cluster contains keywords like physician-patient relations, practice guidance, patient care, interpersonal communications, caregiver, chronic disease, self-care and social support. Cluster 5 is represented in purple. The main keyword in this cluster is methodology with 135 links, a total strength of 1145 and 89 occurrences. Other keywords include questionnaires, statistics, utilization review, and information service.

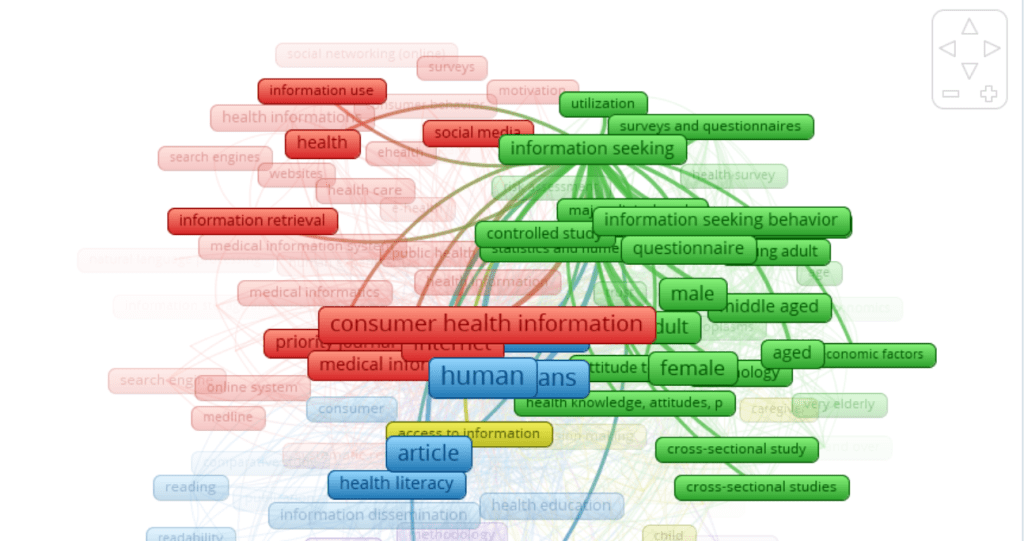
And finally, a visualization that illustrates the relationship between librarians, libraries and CHI.

Link to document with appendices
Works Cited
Consumer Health Informatics. (2018). MeSH Subject Scope Note. https://meshb.nlm.nih.gov/record/ui?ui=D048088
Demiris, G. (2016). Consumer Health Informatics: Past, Present, and Future of a Rapidly Evolving Domain. Yearbook of Medical Informatics, 25(S 01), S42–S47. https://doi.org/10.15265/IYS-2016-s005
Doll, T. (2019, March 11). LDA Topic Modeling. Medium. https://towardsdatascience.com/lda-topic-modeling-an-explanation-e184c90aadcd
Joo, S. (2020, March 2). Topic Modeling [Lecture Notes]. LIS/ICT 662 – Data Analysis and Visualization – Spring 2020 – Week 8, University of Kentucky.
van Eck, N. J., & Waltman, L. (2014). Visualizing Bibliometric Networks. In Y. Ding, R. Rousseau, & D. Wolfram (Eds.), Measuring Scholarly Impact (pp. 285–320). Springer International Publishing. https://doi.org/10.1007/978-3-319-10377-8_13

You must be logged in to post a comment.